E-R Diagram
E-R Diagram example from Database Management course
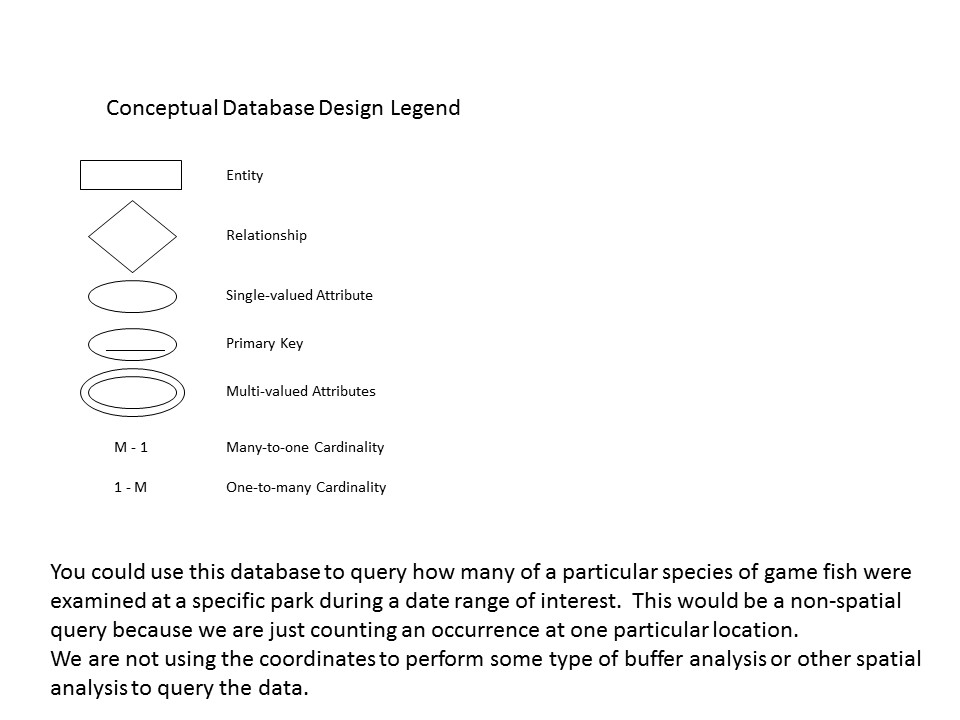
As mentioned before, the entity-relationship (E-R) diagram is one of the most commonly implemented conceptual data models used with GIS. Entities, attributes, and relationships are used to represent real-world features, what their properties are, and what the relationships are between these entities. Hardware and software issues are not explored in the E-R Diagram. These are addressed later in logical and physical data models. This first level of data abstraction is used by geospatial analysts as a starting point when analyzing and assessing the data available to them and how it fits together. The example below illustrates an E-R Diagram built during one of my Geospatial Data Structures course assignments.
As mentioned before, the entity-relationship (E-R) diagram is one of the most commonly implemented conceptual data models used with GIS. Entities, attributes, and relationships are used to represent real-world features, what their properties are, and what the relationships are between these entities. Hardware and software issues are not explored in the E-R Diagram. These are addressed later in logical and physical data models. This first level of data abstraction is used by geospatial analysts as a starting point when analyzing and assessing the data available to them and how it fits together. The example below illustrates an E-R Diagram built during one of my Geospatial Data Structures course assignments.